PPWR Reduction Targets: -5%, -10%, -15% by 2040
PPWR Packaging Waste Reduction Targets: -5%, -10%, -15% Explained
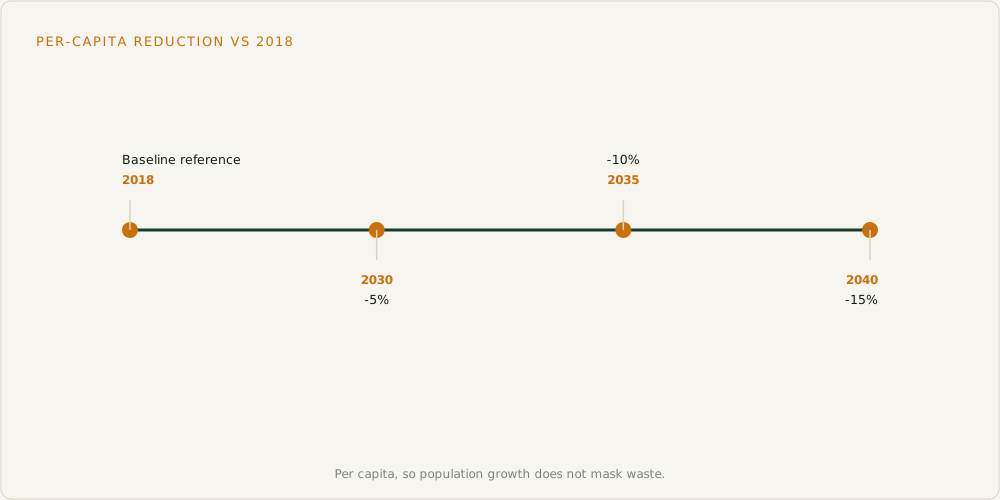
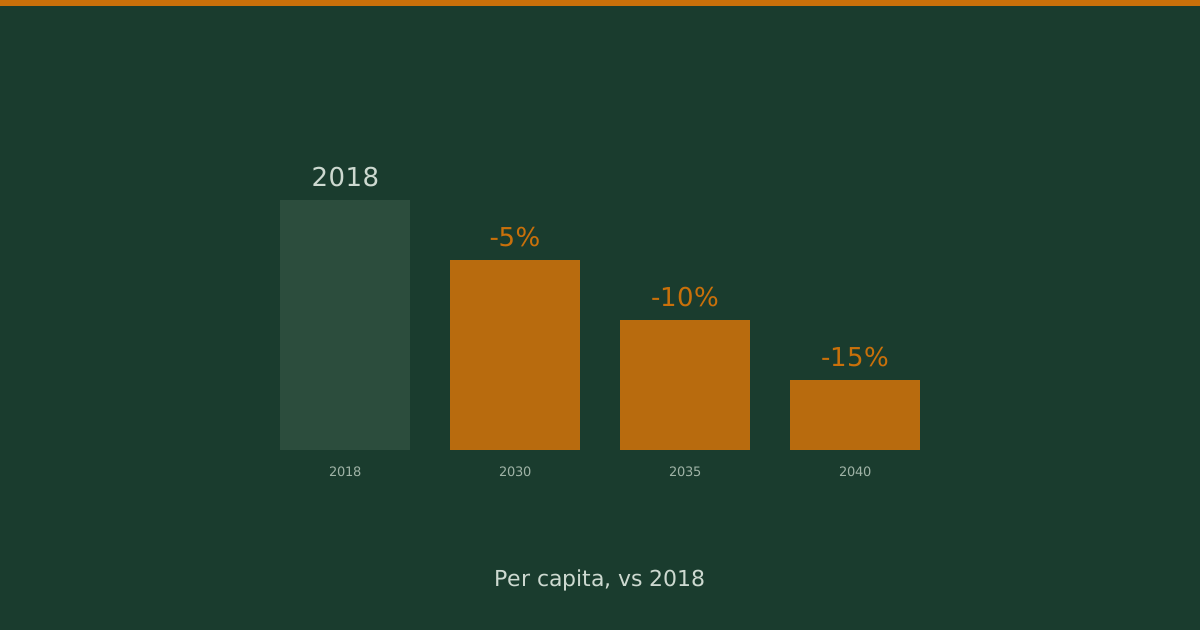
The most-quoted number in PPWR is its reduction trajectory. PPWR reduction targets require packaging waste to fall, per capita, against a 2018 baseline: 5% less by 2030, 10% less by 2035, and 15% less by 2040. Under Regulation (EU) 2025/40, this is the headline commitment that frames much of the rest of the regulation, because minimisation, reuse, and recyclability all feed into it.
The number is widely quoted and just as widely misunderstood. The targets are measured per capita at Member State level, not imposed as a flat -15% quota on each producer. That distinction changes how the obligation actually reaches a company and what a producer can do about it. This guide sets out the three targets, explains the 2018 baseline, clarifies the per-capita per-country measurement, and shows the levers through which producers genuinely move the number. The figures here are the planning frame; confirm the exact percentages, baseline definition, and article references against the consolidated regulation before citing them in a compliance document.
In this guide:
- The three reduction targets and the cumulative trajectory
- What the 2018 baseline means and why per capita matters
- Why this is a Member State target, not a per-company quota
- The levers through which producers actually contribute
- The timeline and enforcement path
- 6-entry FAQ covering the numbers, baseline, and measurement
The Three Reduction Targets
PPWR sets packaging waste reduction targets measured per capita against a 2018 baseline: a reduction of 5% by 2030, 10% by 2035, and 15% by 2040. The targets are set at Member State level and reach producers through national measures rather than as a direct per-company quota.
| Checkpoint year | Reduction vs 2018 baseline | Basis |
|---|---|---|
| 2030 | -5% | Per capita, Member State |
| 2035 | -10% | Per capita, Member State |
| 2040 | -15% | Per capita, Member State |
The trajectory is cumulative and steady: each checkpoint deepens the cut against the same 2018 reference. The steps are spaced to give the packaging system time to shift through design, reuse, and minimisation rather than demanding an overnight change.
What the 2018 Baseline Means
The baseline is the per-capita packaging waste generated in 2018, used as the fixed reference against which every later reduction is measured. Anchoring to a single past year keeps the goalposts still: the 2040 target is -15% against 2018, not against a moving recent average that a bad year could inflate.
Measuring per capita rather than in absolute tonnes is deliberate. A Member State whose population grows would generate more packaging waste in total even if each person's consumption stayed flat, so an absolute target would penalise population growth and reward decline. Per capita normalises that out and measures the thing the regulation actually cares about: how much packaging waste each person generates. Member States measure and report against this baseline, which is why the obligation is framed at country level.
Per Capita, Per Member State, Not Per Company
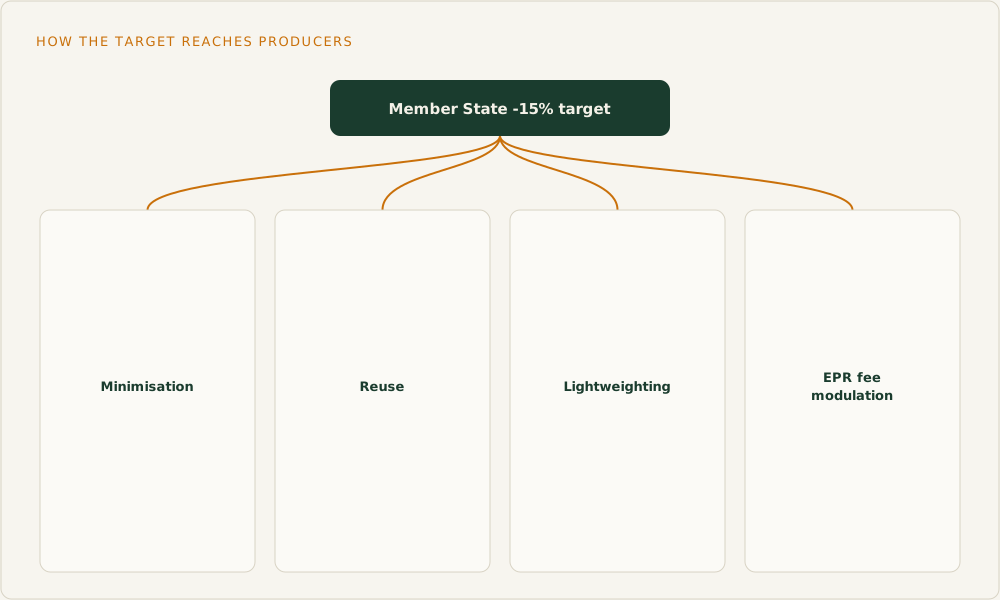
The most common misreading is to treat -15% as a quota every producer must hit on its own packaging. It is not. The target sits on the Member State, which is obliged to bring its per-capita packaging waste down by the set amount and is free to choose the mix of measures that gets it there.
Those national measures are how the target reaches a producer. A Member State delivers the reduction through extended-producer-responsibility fee modulation that rewards lighter and reusable packaging, through the design rules in PPWR, through reuse obligations, deposit-return schemes, and minimisation requirements. So a producer does not report a personal -15%; instead it feels the trajectory through fee structures, design obligations, and the other levers, all pointed at the same outcome. Understanding this is what turns the reduction target from an abstract national number into a concrete set of pressures on a portfolio.
How Producers Actually Contribute
Producers move the number through a handful of practical levers. Minimisation is the most direct: removing empty space and right-sizing packaging cuts material per unit, which the minimisation rules require anyway. Reuse shifts volume out of the single-use stream entirely, on the trajectory the reuse targets set. Lightweighting reduces the weight of each pack, and format consolidation removes whole layers of packaging from a product.
None of these can be managed without data. You cannot reduce what you do not measure, and reduction is a per-SKU exercise before it is a portfolio number: which lines carry the most material, which have the most empty space, which could move to reuse. A portfolio that knows its packaging weight per SKU can target the heaviest contributors first.
Timeline and Enforcement Path
The checkpoints are 2030, 2035, and 2040, with Member States measuring and reporting against the 2018 baseline at each. Enforcement of the headline reduction target operates at Member State level, but the producer-level obligations that deliver it, minimisation, reuse, design conformity, carry their own enforcement. Those are where a producer's direct exposure sits, with fines set nationally under the Article 67 penalty framework. The reduction trajectory is the destination; the producer-level rules are the road, and the road is where compliance is actually checked.
Frequently Asked Questions
What are the PPWR reduction targets?
PPWR requires packaging waste to fall per capita against a 2018 baseline by 5% by 2030, 10% by 2035, and 15% by 2040. The targets are binding at Member State level. Confirm the exact figures and article references against Regulation (EU) 2025/40 before citing them formally.
What is the 2018 baseline?
It is the per-capita packaging waste generated in 2018, used as the fixed reference for every later reduction. Anchoring to a single past year keeps the target stable, and measuring per capita stops population growth from masking or exaggerating progress.
Are the reduction targets per company or per country?
Per country. The target sits on each Member State, which must cut its per-capita packaging waste by the set amount. It is not a flat quota on each producer. Producers feel the trajectory through national measures such as EPR fee modulation, design rules, reuse obligations, and minimisation.
When do the PPWR reduction targets apply?
The checkpoints are 2030 (-5%), 2035 (-10%), and 2040 (-15%), each measured against the 2018 baseline. Member States measure and report at each checkpoint, with the underlying producer-level obligations applying from the regulation's general application in 2026.
How is packaging waste measured for the targets?
It is measured per capita, as packaging waste generated per person, at Member State level, against the 2018 reference year. Per-capita measurement normalises out population change so the figure reflects consumption behaviour rather than demographic shifts.
How can a producer reduce packaging waste under PPWR?
Through minimisation (removing empty space and right-sizing), reuse (shifting volume out of single-use), lightweighting, and format consolidation. All depend on measuring packaging weight per SKU first, so reduction effort targets the heaviest contributors rather than being spread evenly.
Conclusion
The -5%, -10%, -15% trajectory is the headline PPWR number, but it is a Member State per-capita target measured against 2018, not a quota stamped on each producer. It reaches companies through minimisation, reuse, lightweighting, and EPR fee modulation, which is where the real work and the real enforcement sit.
For a producer, the move is to measure packaging weight per SKU, find the heaviest contributors, and act on minimisation and reuse first. The national number then takes care of itself, one portfolio at a time.
Carbonorm quantifies packaging weight per SKU so reduction effort lands where it counts. Start Audit and see which of your lines carry the most material against the targets.